Introducing codeflash-agent: 90% infra cost cut at Unstructured
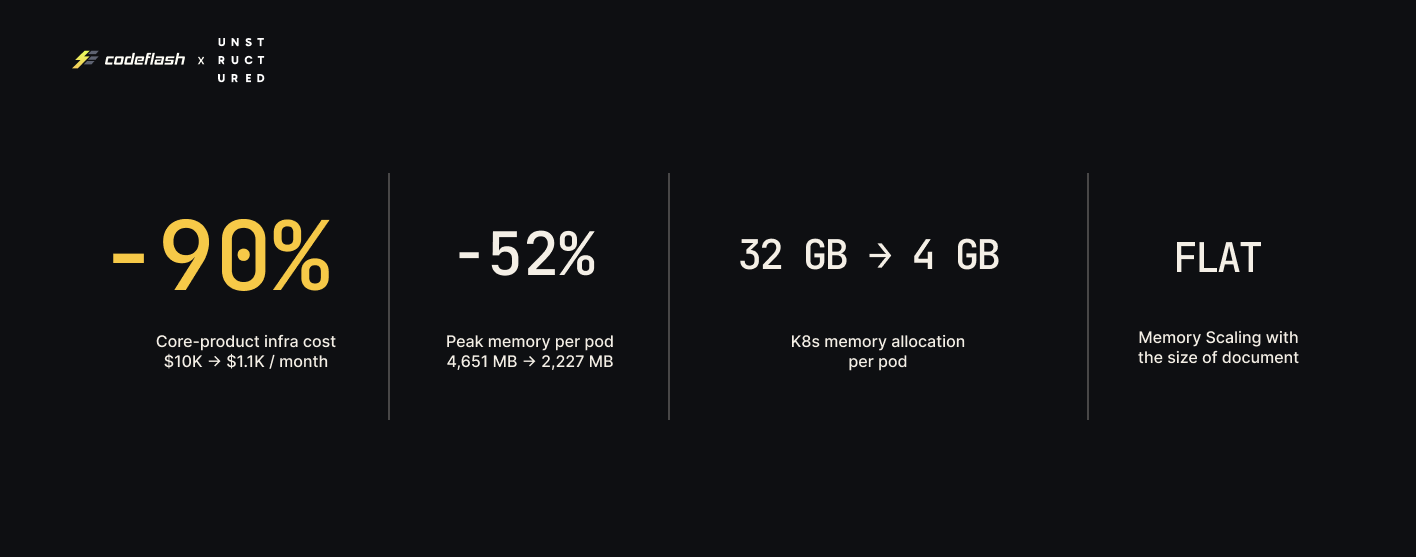
Codeflash cut the infra bill on Unstructured's main document-processing pipeline by 90%. Same hardware, 9.2× the workload, 24 reviewed PRs across five repos, zero regressions.
Unstructured processes billions of documents a month. Their main pipeline turns raw PDFs, images, and office files into clean, structured elements (titles, paragraphs, tables, figures) that downstream LLM and RAG systems can actually use. It ran RAM-bound at 5 pods per node. Seven weeks later, the numbers above are the production result; latency improved 12.9% as a side effect, and latency was never even the objective.
Company-wide performance engineering on this scale used to take a dedicated team a full quarter. This one ran autonomously on codeflash-agent, and it is the first public case study of what the agent does.
A 90% number invites a fair question: what was the starting point hiding? For a fast-moving ML company, the answer is rarely negligence. It is the rational trade off a production team makes under pressure. An OOM kill on an important workload pages someone, costs customer trust, and is loud; a wasted gigabyte of RAM is silent. Root-causing a memory spike in a pipeline that spans document parsing, image processing, model inference, and NLP across a half-dozen interacting subsystems is genuinely hard work, and defensive over-allocation is the cheap, reliable answer that keeps the pager quiet. Most production ML infra is shaped exactly this way. As Crag Wolfe, Unstructured's Chief Architect, put it plainly:
"We knew we could do better, but we didn't have the bandwidth. Functionality improvements were ranked higher on the list. And we'd occasionally see OOMs, which pushed us to keep memory allocations higher than we wanted."
— Crag Wolfe, Chief Architect, Unstructured
The codeflash-agent is a general-purpose performance optimizer that finds and fixes the root causes behind those defensive tradeoffs, on any objective the team can measure: memory, latency, throughput, cold-start, cost.
What a 90% reduction actually looks like
The same hardware now holds 9.2× the workload.
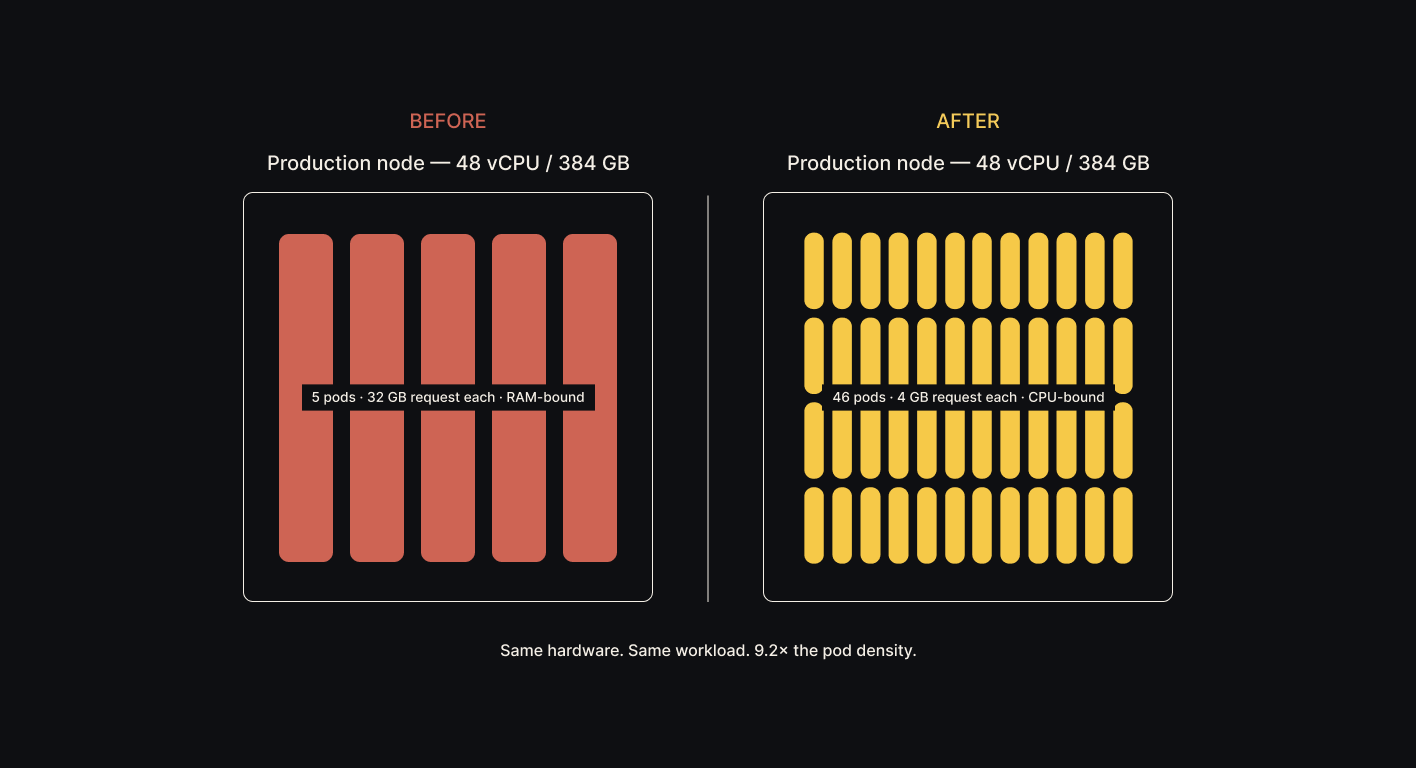
- 9.2× pod density on existing infrastructure. No new nodes to provision.
- 41 previously-idle vCPUs per node freed for throughput or adjacent workloads.
- 12.9% end-to-end latency reduction on the production path (50.8s → 44.3s on a 10-page scanned document).
For an infra or platform team, the story is not "we saved money." It is "RAM stopped being the thing we architect around."
The unit economics are simple: production nodes goes from ~$10,000/month to ~$1,100/month. That is about $107K/year recovered per 10 nodes, $1M/year per ~100 nodes, $10M/year per ~1,000 nodes. The saving scales linearly with cluster size, and the 41 vCPUs per node that used to sit idle next to a RAM-bound pod are free capacity for the next workload, not a rebate you have to negotiate.
"Operationally, the cost-performance profile of our running instances is in a different place. We're seeing fewer tail events where you might hit an OOM, and faster scale-out because we're not bottlenecked on how many pods can fit at once."
— Crag Wolfe, Chief Architect, Unstructured
Inside the 7 weeks at Unstructured
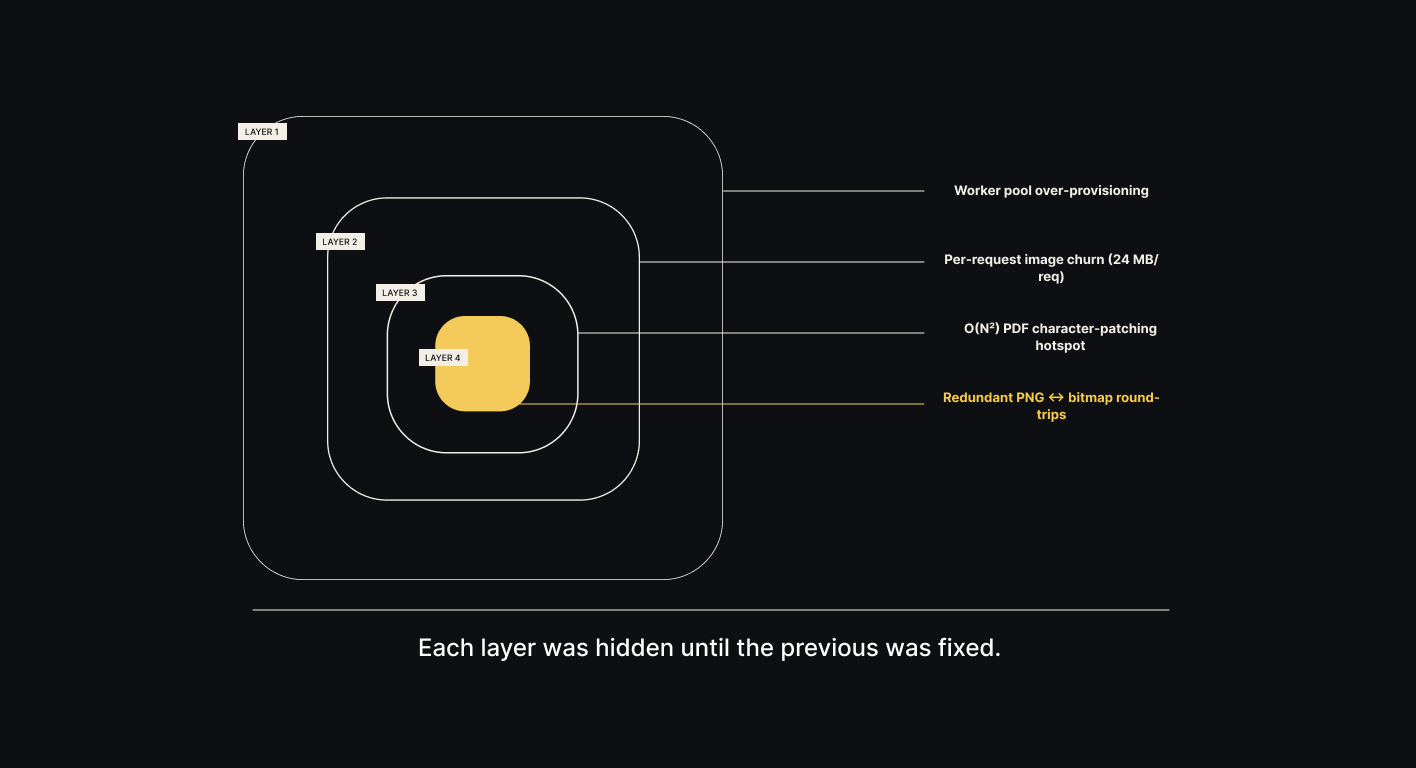
Here's what actually happened. Four stacked bottlenecks, each invisible until the one above it was fixed.
Layer 1: os.cpu_count() was lying
Finding: os.cpu_count() returned the host's 48 CPUs on a pod with a 1-CPU CFS quota. The worker pool spawned 4 workers per pod, each loading the full ONNX model set. 4× the memory for zero parallelism benefit.
Fix: three-tier container-aware detection (cgroup v2 → sched_getaffinity → os.cpu_count(), minimum of all three).
Result: worker pool collapses to one on 1-CPU pods. Memory drops by gigabytes overnight.
A reasonable engineer could have stopped there. The ticket said "32 GB → smaller-number," and smaller-number had arrived. But the agent loop kept going.
Layer 2: 24 MB of per-request creep, hidden in the old baseline's noise
Finding: a per-request memory creep of 24 MB/req in PIL image preprocessing, previously masked by worker-pool noise.
Fix: reorder the allocation so resizes happen on the cheap image representation before the expensive numpy conversion; release page buffers as soon as OCR completes.
Result: 24 MB/req → 17 MB/req.
Layer 3: An O(N²) hotspot that had lived in the code for years
Finding: an O(N²) hotspot in the PDF text-patching path that re-scanned the full character list on every PDF text operator — surfaced once memory noise cleared.
Fix: rewrite as single-pass, tracking a `last_patched` index.
Result: 7.98× median speedup on a 2,000-char page, 14.08× on 5,000 chars. Superlinear, which is the signature of an O(N²)→O(N) change.
Layer 4: Three PNG round-trips on one image, in one request
Finding: three unnecessary PNG compression round-trips on the same image inside a single request — one per subsystem handoff, each decoding what the previous stage had just encoded.
Fix: switch the render and temp format to an uncompressed intermediate; where possible, pass the on-disk path directly between subsystems so the image never round-trips back through Python.
Result: redundant CPU work eliminated from the hottest request path.
Humans would have had a hard time finding these layered optimizations in a short amount of time — and a point optimizer would have stopped at one. The compounding is the product.
Selected public optimizations
A portion of the engagement's optimizations landed in Unstructured's open-source repositories and are public. A sample:
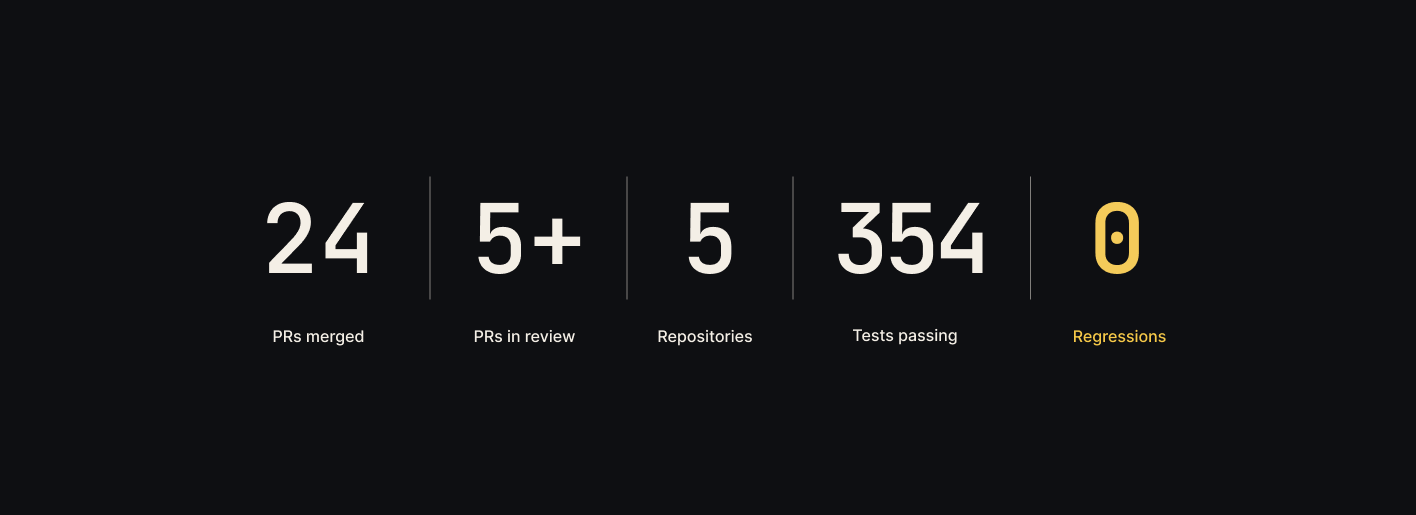
Every PR ships with benchmark numbers, a verification report, and rationale. Links go to the live diffs. Five more PRs are in review as of publication; we'll update this post as they land.
24 PRs. 354 tests green. Zero regressions.
Every PR ships with a Codeflash verification report. Behavior on the changed code path is compared against the original across the existing test suite plus generated test cases the agent writes alongside the change — return values, side effects, and exception shapes checked byte-for-byte. Nothing reaches a reviewer until behavior is provably unchanged. That is how complex changes landed in a production system across multiple repos with no regressions. Correctness is not the trade you make for the speedup; it is the precondition for the PR existing at all.
"What stood out is real demonstrable progress, not theoretical. A PR comes in, we measure RSS before and after on a running system, and the improvement is 2× or 3×. You don't have to run the simulation yourself."
— Crag Wolfe, Chief Architect, Unstructured
Meet codeflash-agent
Everything above came out of a single loop.
codeflash-agent is an autonomous performance engineer. It runs inside a customer's codebase with a global objective (memory, latency, throughput, cold-start, cost) and executes the full performance-engineering loop that a senior engineer would run manually, except it runs it continuously for days and weeks, in parallel, and without tiring.
.png)
Under the loop sits a detailed model of expert-level performance engineering: the real tradeoffs between optimization approaches, which bottlenecks justify which tools, when a local win costs you a global one, and, most importantly, when to investigate deeper and continue experimenting instead of stopping at the first plausible fix. That judgment is why the agent found four stacked bottlenecks instead of one.
This is what separates the agent from a function rewriter. On this engagement it didn't just tune existing code. It identified multi-step data transformations where half the steps were unnecessary, deleted them, and replaced the flow with a better one. That only works if the agent understands what the code is trying to achieve, not just what it's doing.
"It wasn't just tweaks to existing functions. Codeflash understood the abstractions. If a process had six steps, it would recognize that two or three were unnecessary and replace the flow with a better one. That requires really deep understanding of what the code is actually doing."
— Crag Wolfe, Chief Architect, Unstructured
Each turn of the loop:
1. Analyzes the codebase end-to-end to surface optimization opportunities, not just the ones a linter would find.
2. Builds real-world benchmarks against representative workloads: production endpoints, real documents, real request shapes. Not toy micro-benchmarks.
3. Profiles to identify the actual bottleneck for the current objective: CPU, memory, allocator, I/O, contention, fragmentation.
4. Explores multiple optimization strategies per bottleneck, not just the first one that looks promising.
5. Proves correctness through Codeflash's verification system, which pairs the existing test suite with auto-generated test suite using LLMs and formal verifiers to deeply compare the original and optimized code's behavior, including return values, side effects and edge cases.
6. Proves the speedup through Codeflash's benchmarking harness: A/B/A pattern, statistical rigor, standalone and end-to-end against a noise-controlled baseline.
7. Refines the change until it reads like something a senior engineer would have written by hand: idiomatic, reviewable, mergeable.
Then the loop restarts. The previous bottleneck is gone, and that almost always reveals a new one that was masked underneath. This is the engine behind the Unstructured results, and it is the property that turns a point optimization into a 90% company-level reduction.
The codeflash-agent can act on an objective which is anything that is objectively measurable. Memory on this engagement; latency, throughput, or cold start on others.
How a Codeflash engagement runs
Every change arrives as a pull request in your repo. Your engineers review and merge.
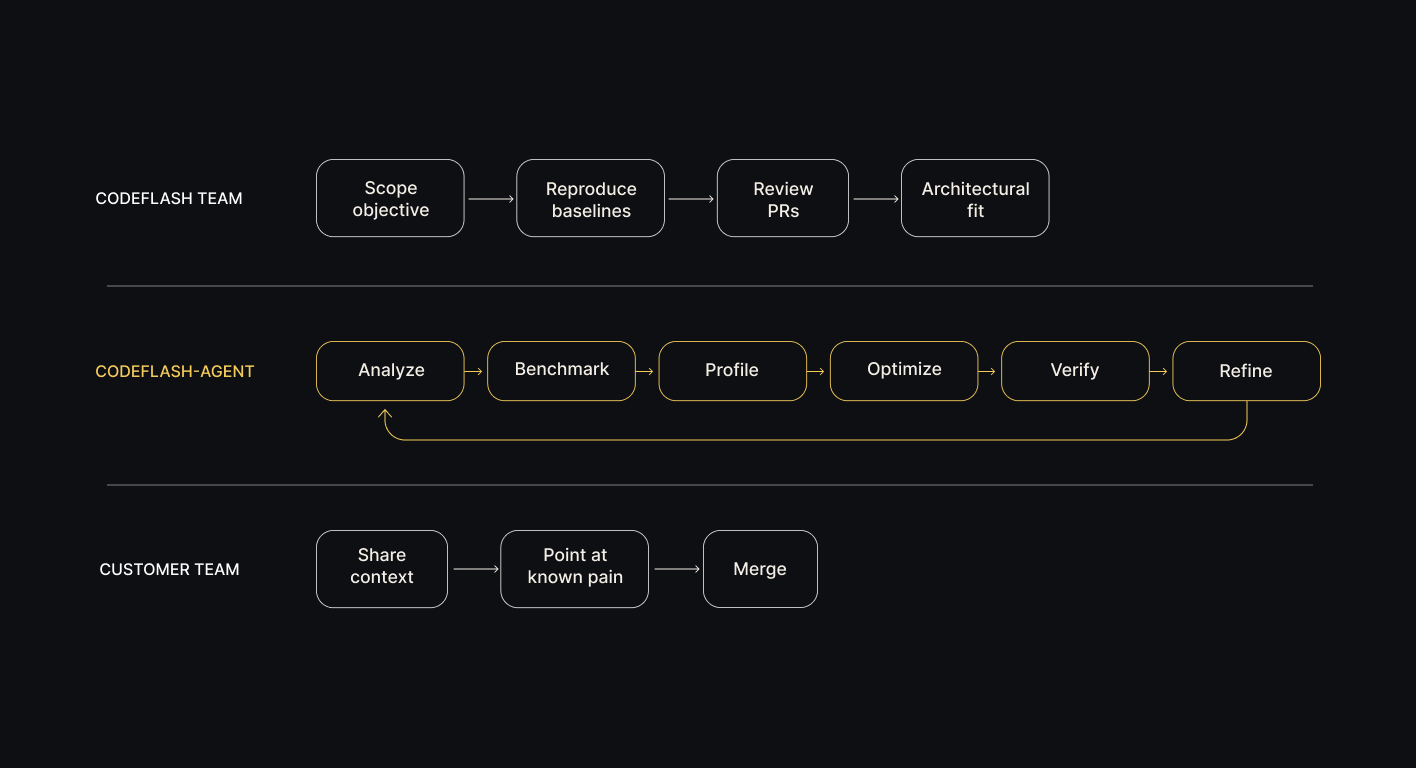
The flow:
1. Scope the objective. What is on the roadmap: pod cost, tail latency, cold start, throughput?
2. Reproduce baselines. On a VM the customer can log into. Every number cited in the engagement is measurable from there.
3. The agent runs. It explores autonomously inside the customer environment in a sandboxed environment. Codeflash engineers point it at the areas the customer flags as hot.
4. Codeflash engineers review every change before it reaches the customer: architectural fit, idiomatic style, merge-readiness. The expert performance engineers also discover any opportunities to optimize the code.
5. PRs arrive with reproducible benchmark numbers, correctness proof, and a short rationale attached. Your engineers review and merge, delivering the gains.
"Having Codeflash (the subject-matter experts on optimization) run the agent makes more sense than asking our engineers, who are focused on product and features, to develop and run that process themselves."
— Crag Wolfe, Chief Architect, Unstructured
The wins compound, they don't decay with time
A 90% reduction is easy to erode. Engineers ship features, AI coding agents generate code against your repo, dependency bumps land on defaults no one profiled, and six months later the savings have drifted back.
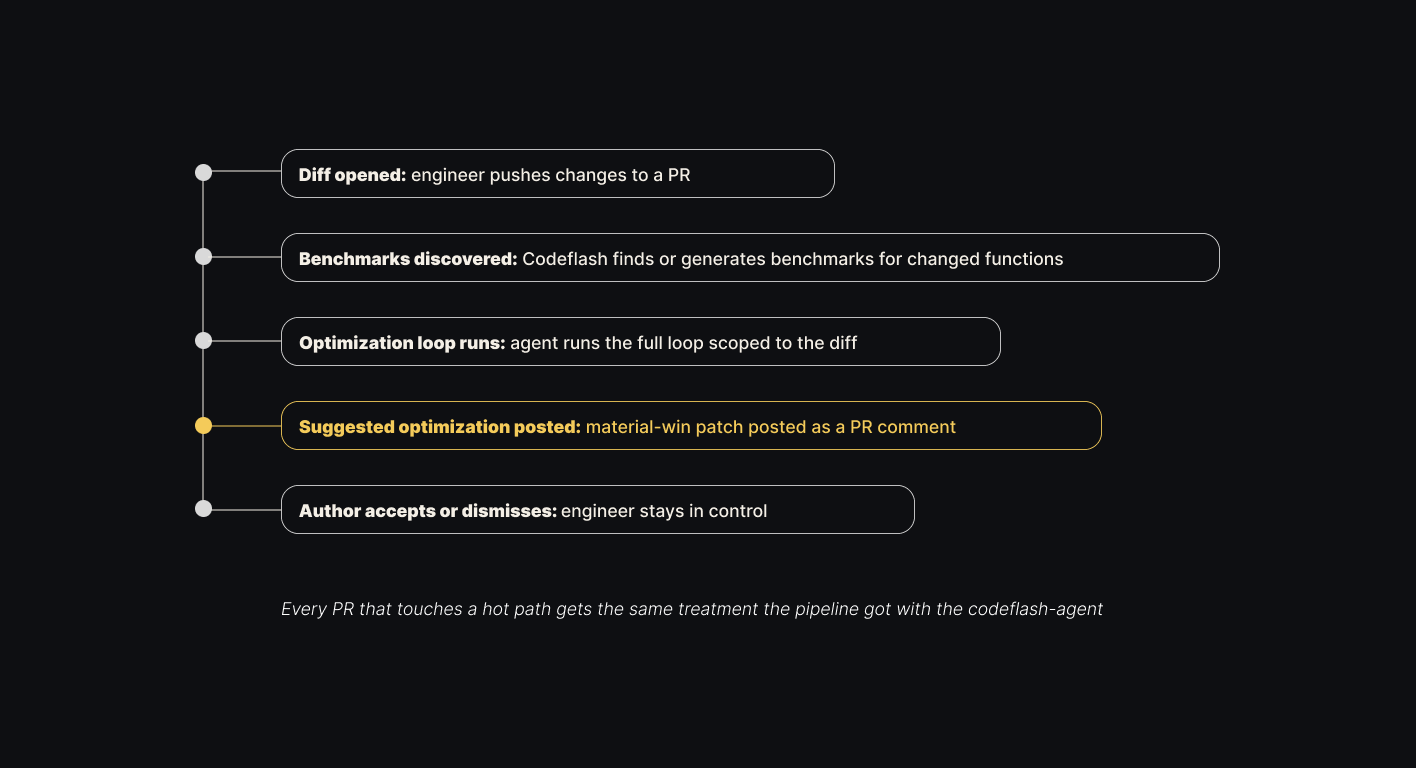
Codeflash runs continuously. After the engagement, the same agent watches every pull request: finds or generates benchmarks for the changed functions, runs the optimization loop scoped to the diff, and posts a suggested patch if it finds a material win. Same engine, pointed at tomorrow's diffs instead of today's hot path.
New code starts optimal. Regressions get caught in the PR that would have caused them, not six months later when pod memory starts climbing again. That is what keeps the initial 90% from drifting back to 50%, whether the diffs come from your engineers, your Claude Code / Cursor / Codex agents, or anything else shipping into your repo.
Signal-to-noise is tuned per team. Some run Codeflash on every PR with a material-win threshold that filters out microsecond-noise suggestions; others pair a lighter per-PR mode with a weekly codebase sweep for the bigger opportunities. Same engine, different cadence.

If the infra bill is a P&L problem
This engagement was not a special case. Container-unaware concurrency, allocator fragmentation, redundant format conversions, lifetime bugs in large intermediates, O(N²) hotspots masked by memory noise: these patterns exist in almost every production Python service at scale. The bottleneck in your codebase is probably different. The agent doesn't care.
Positive ROI, guaranteed. Every engagement is scoped so the infra savings exceed what you pay Codeflash. If the numbers don't pencil out on your workload, we'll tell you before you commit, not after.
If you have a workload you can share with us, we'll tell you what Codeflash would find. codeflash.ai/contact
Stay in the Loop!
Join our newsletter and stay updated with the latest in performance optimization automation.


Stay in the Loop!
Join our newsletter and stay updated with fresh insights and exclusive content.